

What are Survey Design Best Practices?
Survey design best practices are proven principles and guidelines that ensure a survey is user-friendly, inclusive, and scientifically sound. They include structuring questions in a logical, easy-to-follow sequence, using clear, concise language, maintaining consistent formatting across all screens, and optimizing for different devices—particularly mobile.
In addition, these best practices emphasize accessibility compliance (such as adhering to WCAG standards), selecting the right question types (e.g., radio buttons, checkboxes, or text boxes), and applying thoughtful validation to reduce errors without frustrating participants. By following these strategies, researchers and practitioners can improve response rates, enhance data quality, and create a positive experience for survey-takers.
Introduction to Survey Design Best Practices
Surveys are an essential tool for gathering insights in fields like social science research, business, and policy-making. Whether used to measure public opinion, evaluate customer satisfaction, or conduct academic studies, well-designed surveys can produce reliable, high-quality data. Poorly designed surveys can introduce bias, reduce response rates, and create barriers for participants, ultimately compromising data integrity.
With the growing reliance on web-based surveys, researchers and practitioners must follow evidence-based survey design best practices to ensure usability, accessibility, and data accuracy. This article outlines key principles of effective survey design, emphasizing strategies to maximize the data quality obtained.
The Foundations of Effective Web Survey Design
Web surveys are typically self-administered, meaning respondents navigate questions without help. This can increase confidentiality—allowing participants to respond more accurately and comfortably. While this is also true for mail surveys, web surveys can use computer technology to make the survey interactive, which isn’t possible with paper surveys. This unique combination of strengths has made web surveys the main data collection platform for most surveys today.
Research has shown that web surveys often produce higher response rates than mail surveys in populations with high internet access, such as college students. However, certain demographic groups—such as older adults or those with lower digital literacy or access—may not be ideal for web surveys. While web surveys tend to have lower completion rates, this may be because incomplete responses are visible. Partially complete mail surveys usually aren’t returned and remain uncounted.
Core Principles of Good Survey Design Best Practices
To get the best data and user experience, keep these things in mind when designing surveys:
- Reduce cognitive load or burden – Questions should be thoughtfully worded, instructions minimal, and the survey flow should feel intuitive.
- Ensure accessibility and inclusivity – Surveys should be usable by individuals with disabilities and those from diverse linguistic or cultural backgrounds.
- Follow empirical standards – Research-based design principles should guide the structure, wording, and layout of questions. If your study is for a regulatory submission, consider working with a specialized CRO for FDA 510(k) to ensure an FDA-compliant design and execution
Screen Design Standards: Clarity and Consistency
Survey Design Best Practices Tells Us That Visual Layout Matters
A survey’s visual layout significantly impacts readability, usability, and completion rates. Poor layout can lead to fatigue, frustration, and dropout—while a clean, simple interface encourages engagement and completion.
Best practices include:
- Minimizing branding and graphics – Use small logos to maintain professionalism, but avoid excessive branding that might distract respondents.
- Avoiding background images or colors – Simple backgrounds improve readability, and unnecessary images have been found to impact how people respond, ultimately changing study results.
- Use whitespace and remove graphical distractions – Use whitespace or visual dividers to organize questions and responses and to improve navigation. Always check contrast to ensure that the text is readable.
- Provide clear study information – Respondents should easily access privacy policies, consent forms, and support contact details. Where possible, follow plain language guidelines.
Consistent Navigation Improves Completion Rates
Surveys should maintain a consistent layout, ensuring that:
- Question placement and formatting remain uniform throughout the survey.
- Response buttons and instructions are always in the same location.
- Horizontal scrolling is avoided to ensure a seamless experience on different screen sizes.
Should Surveys Include Progress Indicators?
Early research suggested that progress indicators could encourage completion by setting expectations. However, more recent studies indicate that they can sometimes hurt response rates—especially if they give respondents the impression that progress is moving too slowly. Typically, survey takers underestimate the time they have been in a survey—so providing them with information that may increase that perception is not likely helpful.
Best practices include:
- Avoid using progress indicators unless you can test their effectiveness in a pilot study before full implementation.
- Consider using sectional progress indicators (e.g. Part 1 of 4) —but be careful about how they are established (the first section or two should be short) to avoid setting an incorrect expectation of overall length. In research, sectional progress indicators have not been found to impact data quality.
- Remember that mobile devices have limited screen space, so including a progress indicator may take away from necessary question and response space.
How Question and Response Presentation Affects Responses
Research shows that the way questions are displayed influences how respondents interpret them.
Research comparing paging (one question per page) and scrolling (multiple questions per page) has shown mixed results. While paging can reduce cognitive overload and improve data quality, it can also lengthen survey completion time. Scrolling may feel more natural to respondents, especially on mobile devices, but careful layout design is required to prevent excessive scrolling.
Recent studies suggest no significant difference in response rates or breakoff rates between the two approaches—the key is ensuring that questions remain easy to read and interact with regardless of format. Survey designers should consider the nature of their questions and test different layouts to determine the best approach for their audience.
Scale alignment affects perception—Vertical vs. Horizontal scales can carry additional meaning. The way people interpret them may vary. Consider how order effects and standard design principles may influence data quality.
Text and Question Design: Maximizing Clarity and Accuracy
Use sans-serif fonts (e.g., Arial, Verdana) for better readability.
Bold question text while keeping response options in regular font. This helps people differentiate them and orients them to each question rapidly.
Italicize short instructions to distinguish them from questions.
Use red text for error messages, but also include non-color indicators to ensure accessibility.
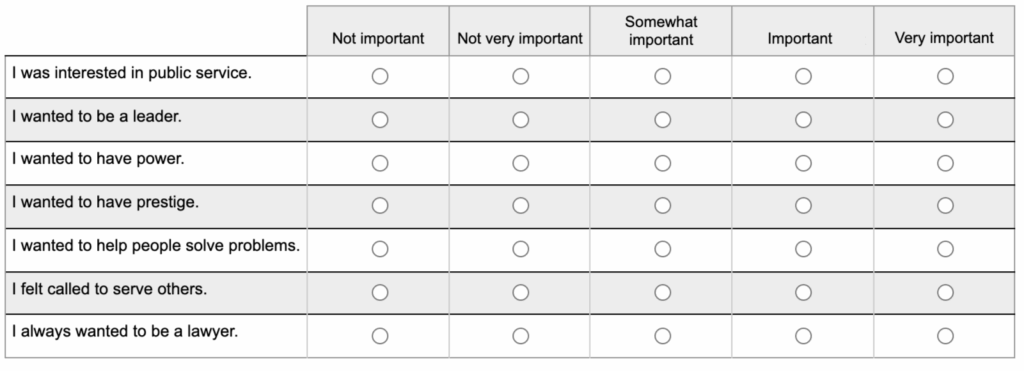
Grid Questions: Use with Caution
Grids are a convenient way to include multiple questions in a small, compact area. They may also increase the speed at which someone can respond—however, consider whether that speed is a good thing. Likely speed is gained in exchange for time spent carefully reading each item. Grids can increase the likelihood of seeing “straight liners”—those who pick an answer in a grid and answer straight down a column for all items on the page.
When used, grids should be:
- Avoided for multiple-response questions (i.e. checkbox questions), as they often confuse respondents.
- Limited in size to prevent fatigue and reduce straight-lining and other similar errors..
- Shaded in alternating rows to improve readability (using good contrast to ensure that the text is still readable
.
Response Input Standards: Matching the Right Format to the Question
At the heart of all web pages is a language called Hyper Text Markup Language (HTML), which includes several standard widgets for input forms. These widgets are expected and anyone using the web is familiar with how they work.
- Radio buttons – Best for single-response questions.
- Checkboxes – Used for multiple-choice questions.
- Dropdown menus – Only appropriate for long lists where respondents can easily find their answer (e.g., state selection).
- Textboxes – Should match expected response length (e.g., short for ZIP codes, long for open-ended responses).
Many survey systems offer other fancy tools like “sliders.” Be cautious about using them—and minimally test to ensure they function well on a mobile screen. They may also introduce more problems related to accessibility.
Survey Design Best Practices With Survey Logic & Validations
Real-time validation techniques—such as soft prompts for missing data, automatic range checks for numerical responses, or adaptive follow-up questions—can improve data quality. However, excessive validation messages can frustrate respondents, leading to higher dropout rates. A best practice is to use validation only when necessary and allow respondents to continue without correction when possible (e.g., offering a ‘Prefer not to answer’ option rather than forcing a response).
Survey Design Best Practices Ethical and Accessibility Considerations
Should Respondents Have an Easy Exit?
Many web surveys omit a quit button to discourage dropouts. Research has found that including a quit button only increases the chances of any given participant leaving the survey early. While most would agree that respondents should be able to leave a survey at anytime, the best solution is to ensure automatic saving of responses. If the survey system is always saving, participants can just close the browser and leave as they wish.
Ensuring Accessibility for All Respondents
Screen readers – Surveys should have ARIA labels to assist visually impaired users.
Adjustable fonts and contrast – Compliance with WCAG 2.1 AA standards ensures readability and meets current requirements for all higher education/academic researchers working at public universities.
Consider multi-language support if your study population has non-English speakers. If multiple languages are offered, because it is important to maintain standardized instruments, we recommend requiring that the language is set at the start and remains with that same language through to the end.
2024 ADA Compliance Update
The 2024 update to Title II of the Americans with Disabilities Act (ADA) requires public universities to comply with accessibility standards by April 2026 (ADA Web Rule, 2024). In addition to meeting WCAG 2.1 AA standards, surveys must be:
- Fully navigable with a keyboard (no mouse required).
- Readable by assistive technologies such as screen readers.
Survey Design Best Practices for Mobile Users: Designing for Small Screens
With many respondents completing surveys on smartphones, mobile optimization is no longer optional—it is essential. Poor mobile compatibility can lead to higher break-off rates, particularly if respondents struggle with navigation, small tap targets, or excessive scrolling. Surveys should be designed with a mobile-first approach, ensuring that:
- Buttons and input fields are large enough for touchscreens
- Text remains readable without zooming
- Scrolling is minimized through adaptive layouts
- All interactive elements function properly across different devices and operating systems
Web surveys should be tested on iOS and Android devices to ensure smooth user experiences before deployment.
Additionally, care should be taken when deciding on design elements. While a mobile-first approach may be best, if your survey is adaptive, you want to understand how the adaptation changes the stimulus of the questions being asked. For example, a common adaptation is that grid questions with horizontal response category display on large screens are broken out into individual vertical response display questions on mobile. This switch can have a significant impact on how people answer those questions.
Testing and Pilot Studies: The Key to Continuous Improvement
Good quality test and pilot efforts are increasingly rare in today’s research world. Often, researchers trust that they can create a questionnaire that study participants will understand just as they do. This just is not the case.
Whenever possible, before launching a survey, we recommend:
- Cognitive interviews with naive respondents to evaluate any newly created questions, or questions that have not been asked of a specific population before.
- Usability testing to detect problems with the interface; this is especially important if using any non-traditional form fields.
- Pilot studies will evaluate the overall process over time, identify breakoff rates, and evaluate the full process for logistical or technical issues.
Survey Design Best Practices Wrap-Up
Designing effective web surveys requires combining scientific rigor, human factors, and attention accessibility. Researchers can minimize bias, reduce respondent burden, and improve data quality by following best practices in question design, screen layout, response input, and navigation. Thoughtful consideration of mobile responsiveness, accessibility compliance, and ethical guidelines ensures that surveys reach diverse populations and yield reliable insights.
While following survey design best practices may improve your survey, we must also always remember—surveys are not rocket science! That is because they involve humans doing human things—which turn out to be more challenging to control than the most complex of rockets.
We recommend bringing a survey methodologist onto your team. A good survey methodologist can give you a broad understanding of the trade-off decisions that involve cost and quality. They should be able to step you through the decision process necessary to design the best study for you.
Ultimately, survey design is also an evolving practice. As technology advances and new research emerges, it is essential to test and refine survey methodologies continuously. By applying evidence-based strategies, researchers and practitioners can create surveys that not only collect accurate and meaningful data but also respect and engage respondents throughout the process.
SoundRocket Staff Involved References
- Crawford, S. D., Couper, M. P., & Lamias, M. J. (2001). Web surveys: Perceptions of burden. Social Science Computer Review, 19(2), 146–162. Link
- McCabe, S. E., Boyd, C. J., Couper, M. P., Crawford, S., & d’Arcy, H. (2002). Mode effects for collecting alcohol and other drug use data: Web and US mail. Journal of Studies on Alcohol, 63(6), 755–761. Link
- Couper, M. P., Tourangeau, R., Conrad, F. G., & Crawford, S. D. (2004). What they see is what we get: Response options for web surveys. Social Science Computer Review, 22(1), 111–127. Link
- Peytchev, A., Couper, M. P., McCabe, S. E., & Crawford, S. D. (2006). Web survey design: Paging versus scrolling. Public Opinion Quarterly, 70(4), 596–607. Link
- Crawford, S., McCabe, S. E., & Pope, D. (2014). Applying web-based survey design standards. In Technology Applications in Prevention (pp. 43–66). Routledge. Link
- Crawford, S. (2002). Evaluation of web survey data collection systems. Field Methods, 14(3), 307–321. Link
- Baker, R. P., Crawford, S., & Swinehart, J. (2004). Development and testing of web questionnaires. In Methods for Testing and Evaluating Survey Questionnaires (pp. 361–384). John Wiley & Sons, Inc. Link
- McCabe, S. E., Boyd, C. J., Young, A., & Crawford, S. (2004). Feasibility study for collecting alcohol and other drug use data among secondary school students: A web-based survey approach. Journal of Drug Education, 34(4), 373–383. Link
- Peytchev, A., & Crawford, S. (2005). A typology of real-time validations in web-based surveys. Social Science Computer Review, 23(2), 235–249. Link
- Friese, C. R., Lee, C. S., O’Brien, S., & Crawford, S. D. (2010). Multi-mode and method experiment in a study of nurses. Survey Practice, 3(5). Link
- Saltz, R. F., Freisthler, B., Paschall, M. J., & Crawford, S. (2004). Response rate and potential sample bias in web-based survey of college students. Alcoholism: Clinical and Experimental Research, 28(5), 33A. Link
- Sakshaug, J. W., & Crawford, S. D. (2010). The impact of textual messages of encouragement on web survey breakoffs: An experiment. International Journal of Internet Science, 4(1), 50–60. Link
Other Relevant References
- Dillman, D. A., Smyth, J. D., & Christian, L. M. (2014). Internet, Phone, Mail, and Mixed-Mode Surveys: The Tailored Design Method. Wiley.
- Couper, M. P. (2008). Designing Effective Web Surveys. Cambridge University Press.
- U.S. Department of Justice. (2024). ADA Title II Web Accessibility Rule. Link
- Nikivincze, I., & Ancis, J. (2018). “Accessible But Not Usable: Improving Practices for Surveying People with Disabilities.” RESNA Annual Conference Proceedings. Link
- Clark, J. (2003). “Universal Design for Web Surveys: Practical Guidelines.” Survey Practice, 1(1). Link
Get Your Free Survey Checklists
Designing effective surveys requires clarity, accessibility, and thoughtful planning. Our expert-created checklists will help you refine your approach and improve survey outcomes.
What’s Included?
- Survey Design & Implementation Checklist – A step-by-step guide to designing, testing, and launching effective surveys.
- Accessibility & Inclusivity Checklist – Ensure compliance with ADA & WCAG standards and create surveys that work for all respondents.
Get Instant Access
Enter your details below to download both checklists and start improving your survey design today.